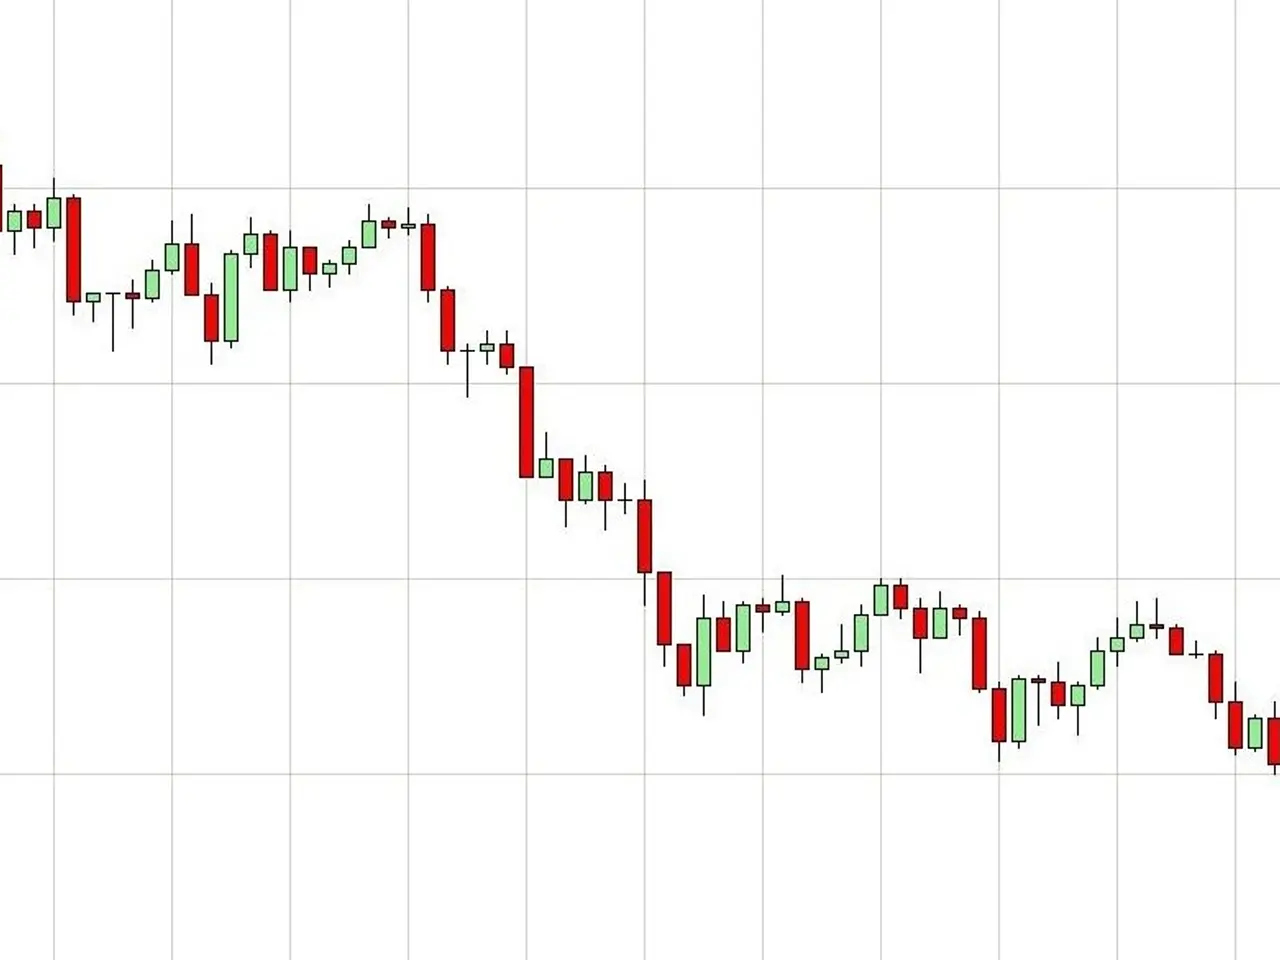
Take-Two Interactive Software, Inc.
Take-Two stock teeters at a make-or-break chart juncture
The stock is once again trading at a critical juncture: between $215 and $222, where multiple horizontal resistance levels converge alongside key moving averages (the 50-week EMA and the 200-day EMA).
Double Bottom vs. Head & Shoulders
The share currently stands at a pivotal crossroads on the chart, where its medium-term trajectory may soon be decided. If the stock breaks sharply downward from this hurdle and retests recent lows, the risk of a long-term head-and-shoulders top formation (H&S) increases. However, this pattern would only be confirmed by a sustained drop below $184.
For now, the focus remains on the central resistance zone between $215 and $222. A significant breakout above $223 would markedly improve the broader outlook. This would complete a double-bottom pattern at the $188–$189 support level, potentially kickstarting a new upward wave toward the all-time high of $264.785.
Conclusion: Take-Two Interactive's stock may be on the verge of a major directional move. Buyers hold the key to confirming a double-bottom formation—but if they lose momentum now, a second right shoulder in a large head-and-shoulders top could emerge. I don't favor a specific forecast scenario here, though the bulls have a slight short-term edge.
Also of interest: * Berkshire Hathaway – Can Greg Abel bring fresh momentum?


